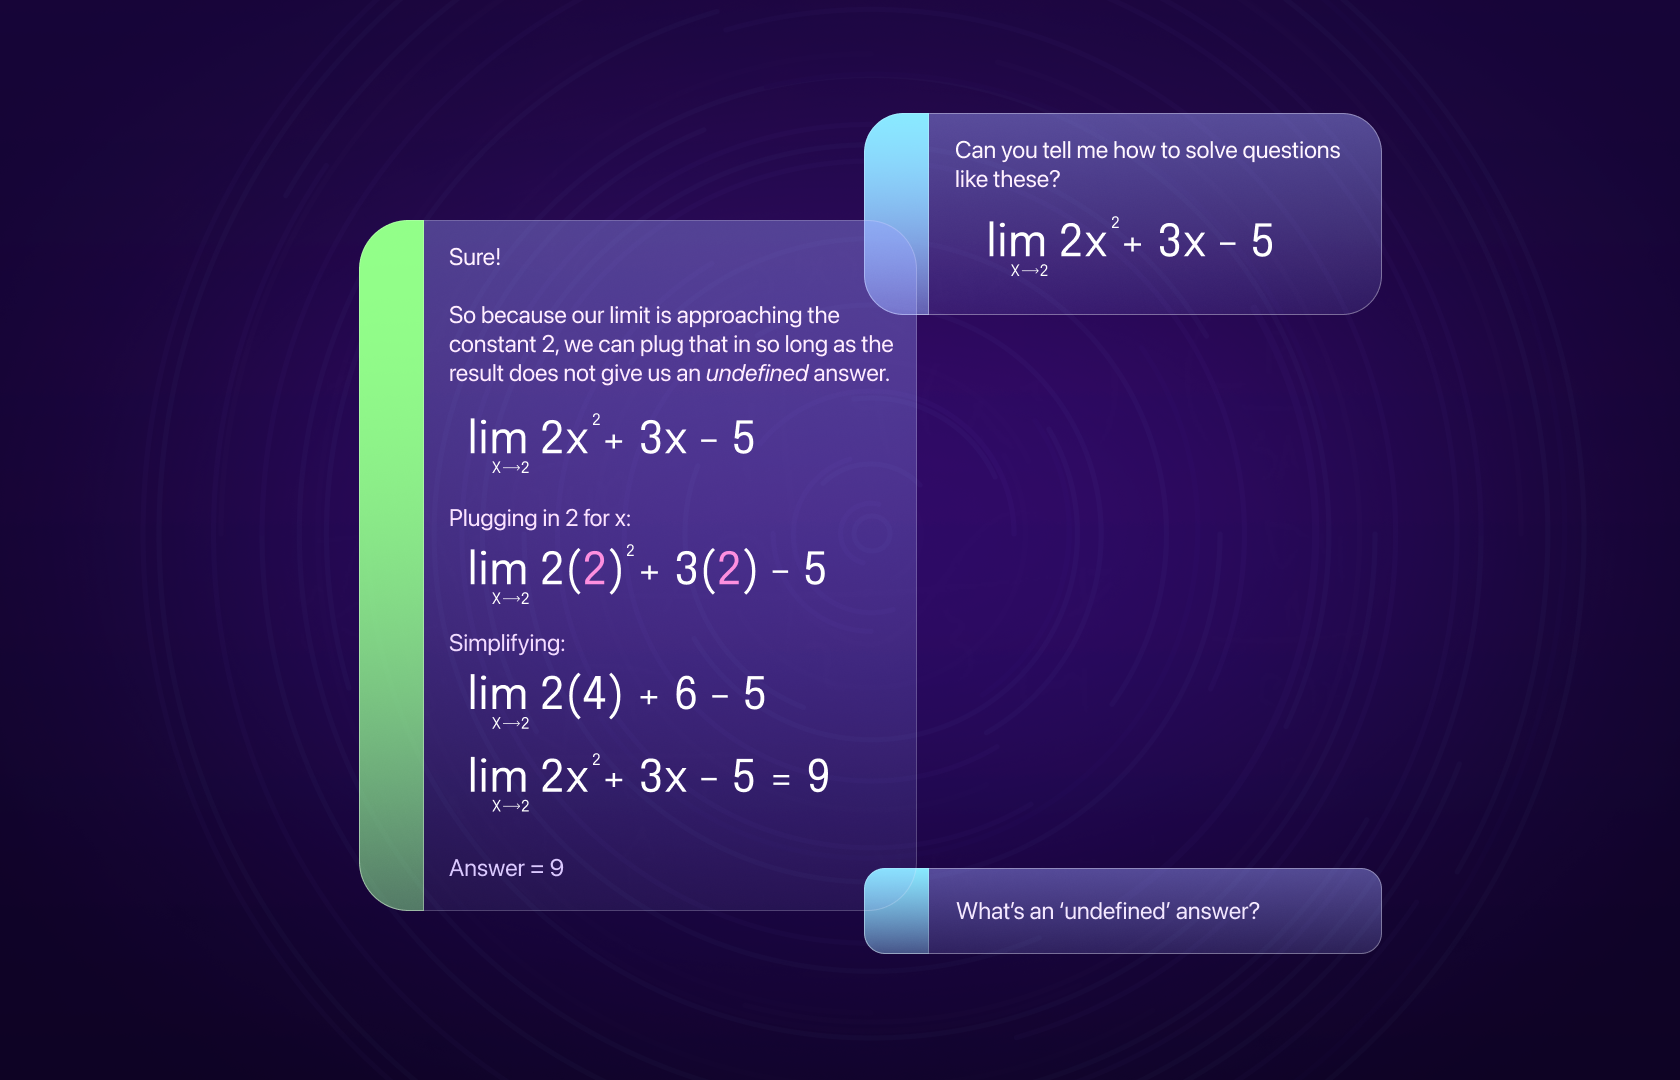
Introduction
LLMs have turned AI from some opaque technology for ML teams to something a developer can instrument in a couple of hours.
This lower barrier to entry is empowering developers to build wide-ranging AI-powered apps, from chatbots to agents.
One thing these developers quickly realize? Neither MLOps nor traditional monitoring tooling helps developers seamlessly track how their code and users interact with their AI.
This is the problem Autoblocks was built to address.
Developers can add powerful debugging, testing, and fine-tuning capabilities to any codebase within a few minutes.
In this post, I used two of the platform's core features — Traces and Replays — to turn Vercel’s open-source AI chatbot into a personal math tutor. I’ll show you how an LLMOps tool, like Autoblocks, can help you better understand your AI applications so that you can iterate on them thoughtfully.
Let's dive in!
How to Use Traces for Prototyping
First, we need to get the basic chat app up & running. Then, we can worry about about making it better.
The Autoblocks platform and SDK simplify 1/ capturing all of your AI events and 2/ structuring them into intuitive traces. We can use Autoblocks Traces while prototyping to make sure the app is working as it should.
Before sending events, however, we’ll need to set up Autoblocks in our project. We can start by downloading the JavaScript SDK.
npm install @autoblocks/clientWe’ll also need an ingestion key so Autoblocks can authenticate our API calls. After making an account, we can get the key from the Settings tab.

Then we can set it with the following bash script.
export AUTOBLOCKS_INGESTION_KEY=<ingestion_key>Finally, we need to import the AutoblocksTracer class.
import { AutoblocksTracer } from '@autoblocks/client';With the setup out of the way, we’re ready to send events from our chat route! We’ll initialize the AutoblocksTracer class, passing it our Autoblocks ingestion key, a unique trace ID, and any additional properties we want to track (like LLM provider).
Note: Autoblocks gives you full control over the data you send into the platform. They recommend sending in as much telemetry data as possible (since it will help you create really good fine-tuning datasets down the road).
const tracer = new AutoblocksTracer(
  process.env.AUTOBLOCKS_INGESTION_KEY ?? "",
  {
    traceId: crypto.randomUUID(),
    properties: {
      app: 'AI Chatbot',
      provider: 'openai'
    }
  }
);
We can send our first event when we create our chat completion using the AutoblocksTracer. sendEvent method.
const completionProperties = {
  model: 'gpt-3.5-turbo',
  messages: [systemMessage, ...messages],
  temperature: 0.1,
  stream: true
}

const res = await openai.createChatCompletion({
  ...completionProperties,
})

await tracer.sendEvent('ai.request', {
	properties: completionProperties,
});
Let’s send another event when we start streaming the completion…
async onStart(){
	await tracer.sendEvent("ai.stream.start")
}
…and one when the stream completes.
By including the completion as a property of our event, we can use Autoblocks to track the response generated by OpenAI.
async onCompletion(completion) {
	await tracer.sendEvent("ai.stream.completion", {
	  properties: {
	    completion
	  }
	})
	//Update chat with new completion
}
To start seeing traces in Autoblocks, we can run our chatbot application and send a message.
You should see a trace corresponding to the message on the Autoblocks Explore tab within a few seconds.

We can also expand the trace to get a more in-depth look at the events and their corresponding properties.
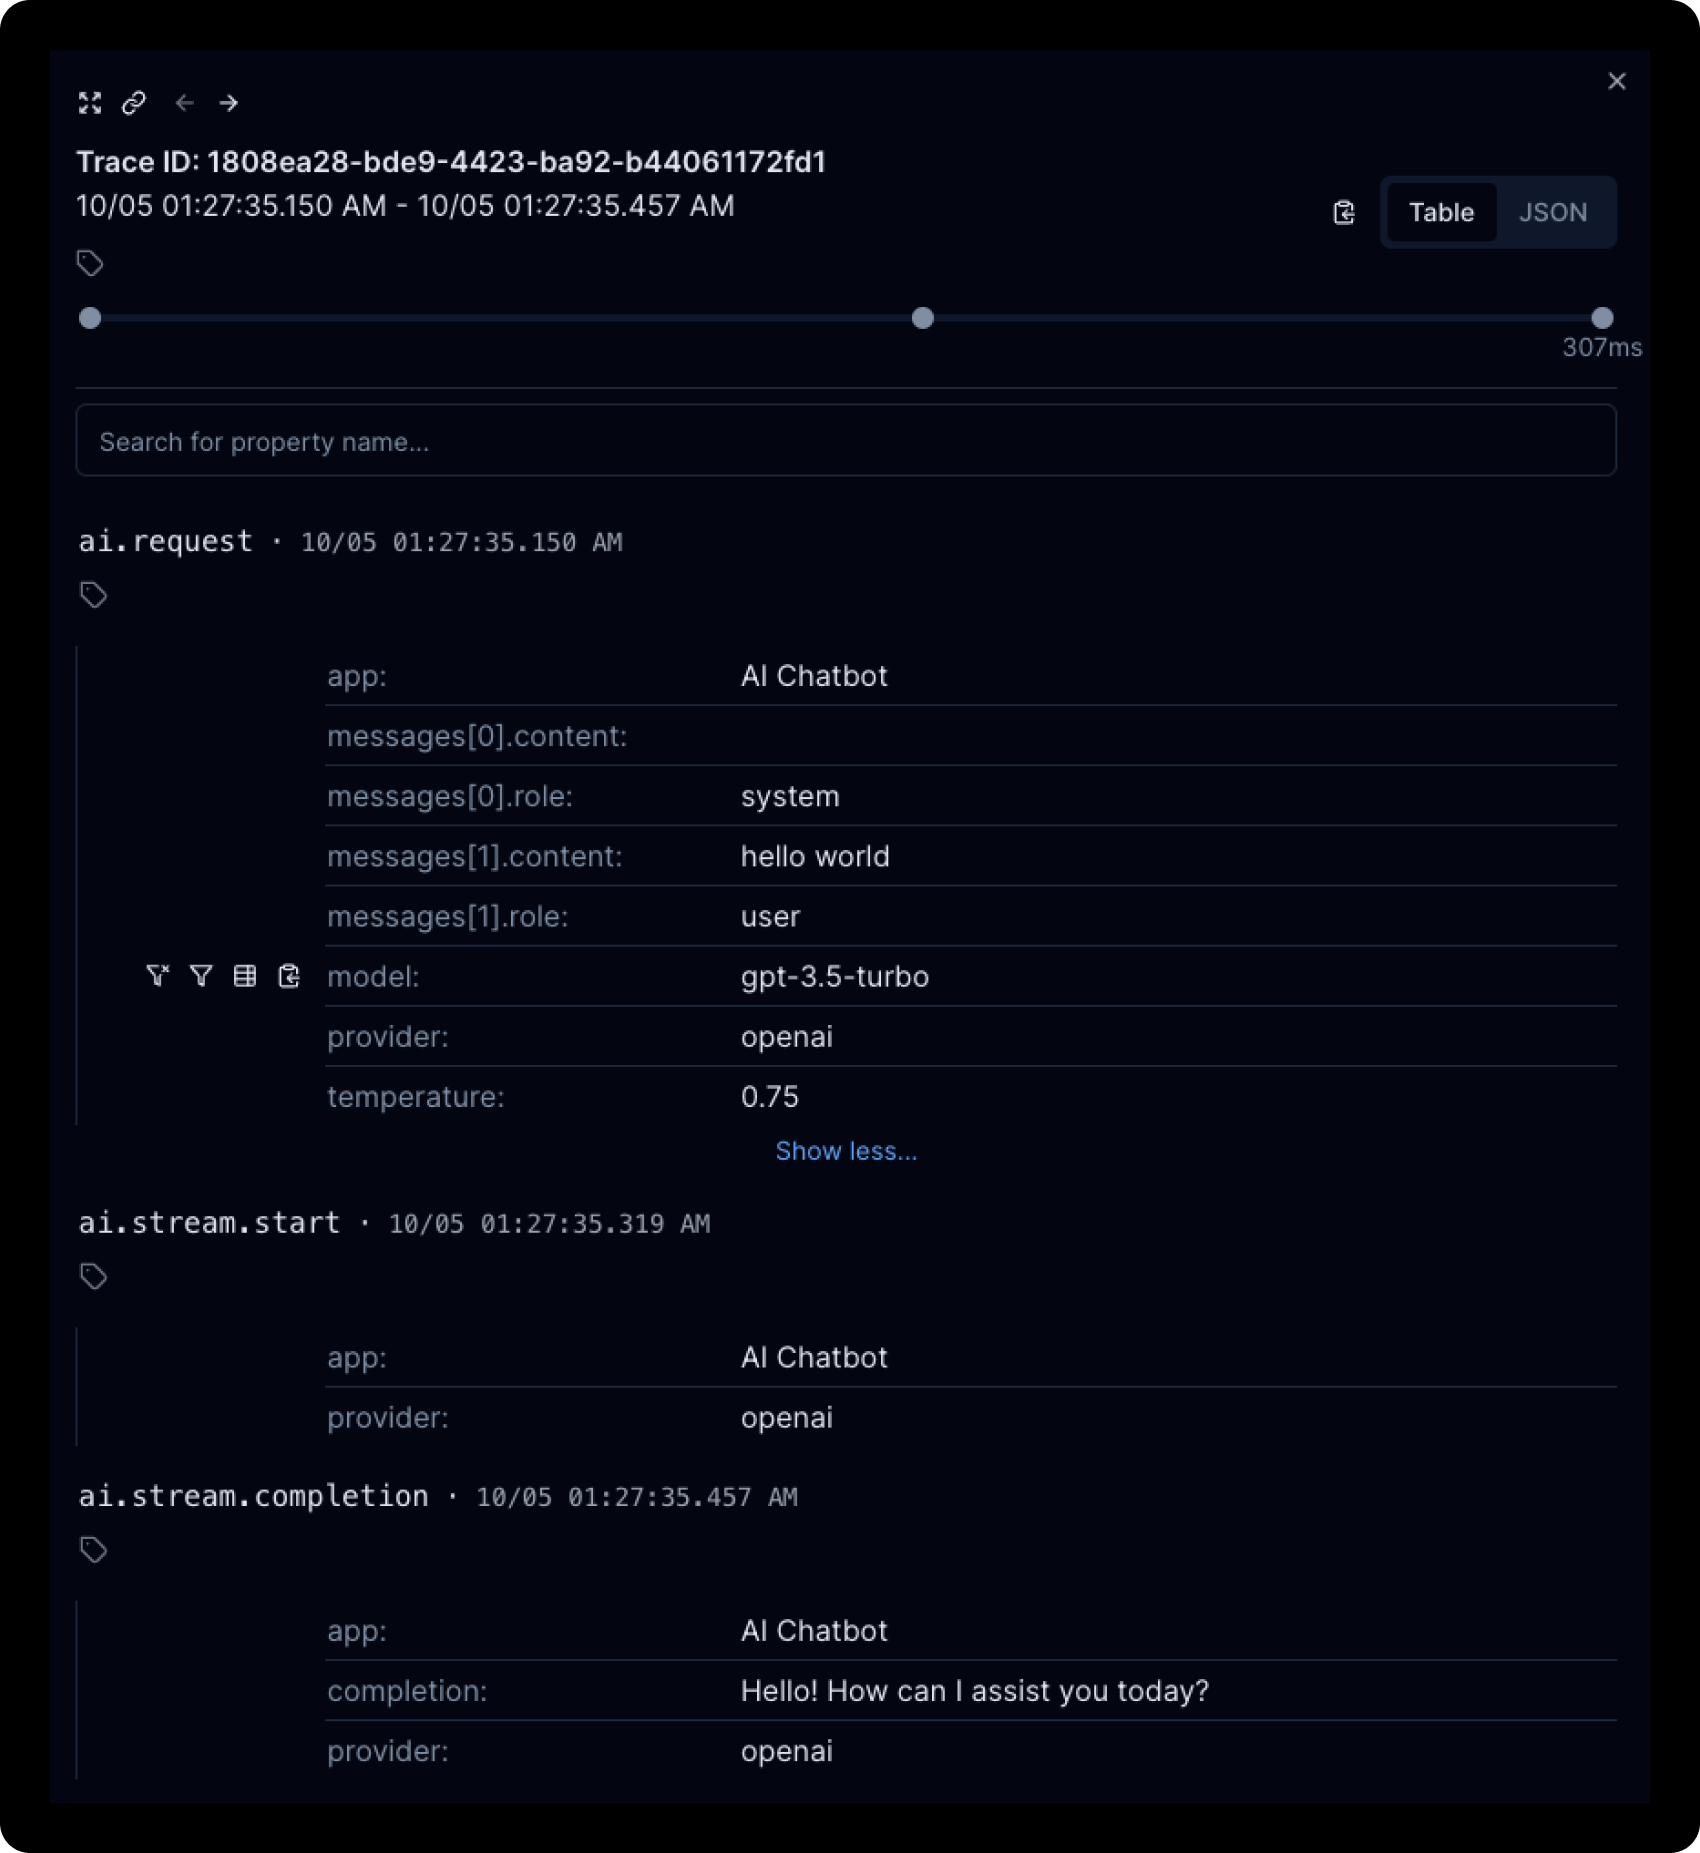
Violá! ✨ We’re now taking advantage of Autoblocks Traces to see what’s going on under the hood of our chatbot.
When we’re ready to deploy to production, these traces will help us track and understand user interactions with the LLM (I’ll dig into this more later in the blog).
Let’s take it one step further and look at how Replays can help us modify our application.
How to Test Changes to Your AI App
Now that our chatbot works, we can customize it to turn it into a stellar math instructor. The system prompt is a great place to start, as it's easy to iterate on and can significantly impact the chatbot's response quality.
Autoblocks Replays build on the concept of traces, allowing us to compare changes in our LLM calls as if we were doing a diff comparison of code.
Think: snapshot testing with an interface like GitHub’s code review.
We can use Replays during local development to review changes to our app’s prompt(s) before deploying them, creating a great prompt engineering workflow.
Fortunately, Autoblocks makes switching between sending production traces and replays as easy as swapping an environment variable, allowing us to use the same sendEvent method to handle both.
To get started with Replays, we first need to replace our ingestion key environment variable with the replay ingestion key provided by Autoblocks. This key tells Autoblocks that our events are part of a replay, not normal user traffic.

Since we’re developing locally, we’ll also need to set a replay ID so Autoblocks can group our replay events. We can do this when we start our app.
AUTOBLOCKS_REPLAY_ID=aidan-$(date +%Y%m%d-%H%M%S) npm run devUnlike production traces, we need to make sure the trace ID and input are consistent between replay runs to compare them later.
const tracer = new AutoblocksTracer(
	process.env.AUTOBLOCKS_INGESTION_KEY ?? "",,
	{
	  traceId: process.env.SQUARE_ROOT_TWO_TRACE_ID,
	  properties: {
	    app: 'AI Chatbot',
	    provider: 'openai'
	  }
	}
);
Our replay is good to go. ✅
We can add a system prompt in the messages we include in our chat completion request to start tinkering with the LLM’s behavior.
Let’s try three different prompts and compare the results.
To test them, we can ask the chatbot a fun (😅) discrete math question: why is √2 irrational?
We can start with an empty system prompt for our baseline trace for the other replays.
When we chat with the app and create a trace, it will appear in the Replays tab in Autoblocks, along with the git branch from which we ran the replay.

We can click on the replay to view its details.
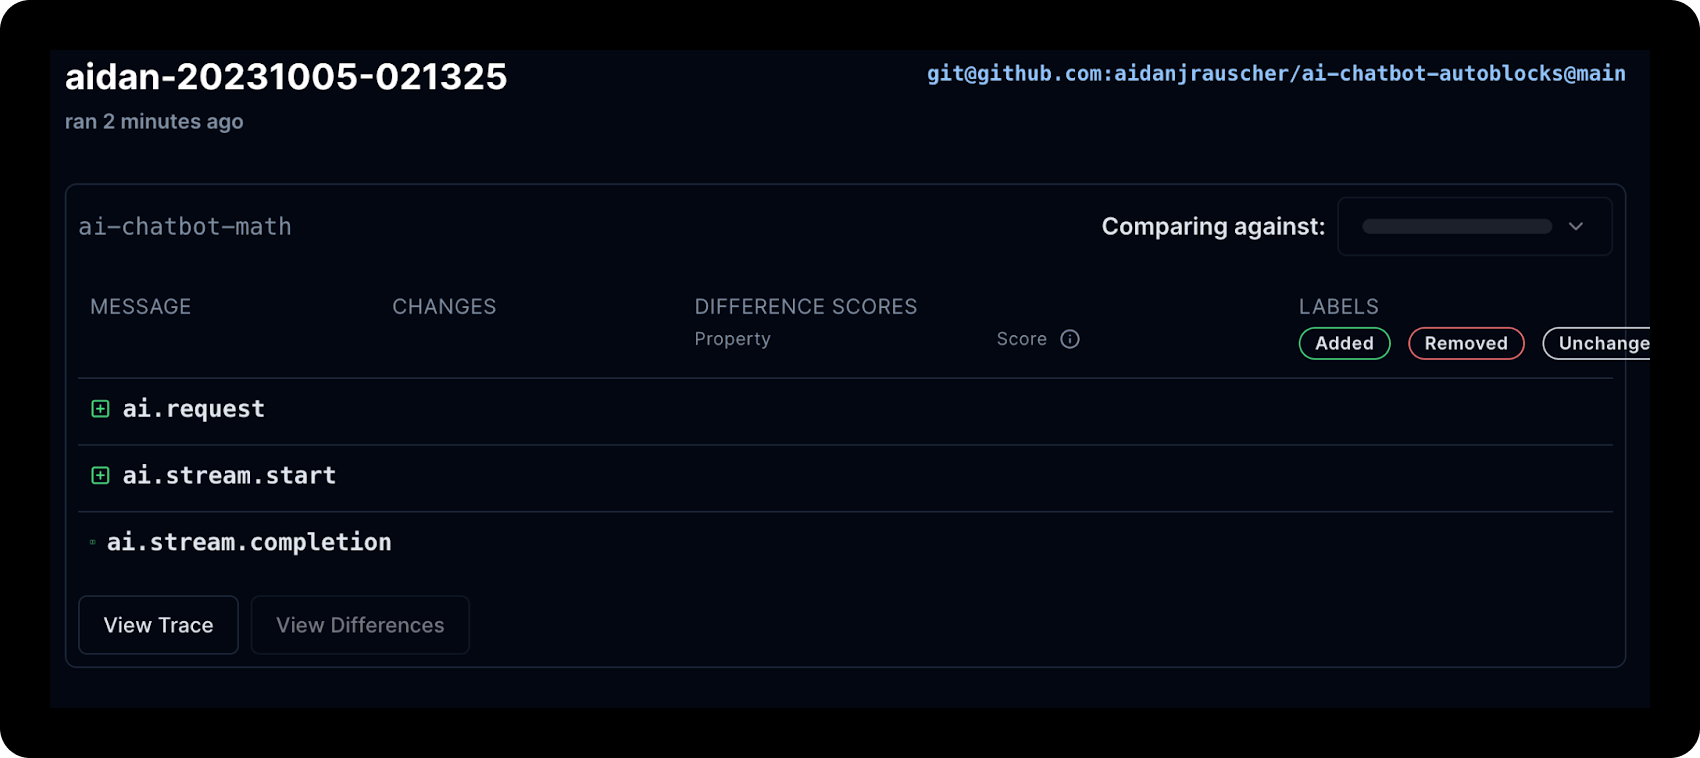
Let’s run the same process with our mildly descriptive prompt. We have to update the Autoblocks replay ID to create a new replay. Once we do that, we can view the details.

The replay will be compared against the baseline trace, showing us the additions and deletions from different events (at a high level). We can click the View Differences button for a more detailed comparison of the traces.
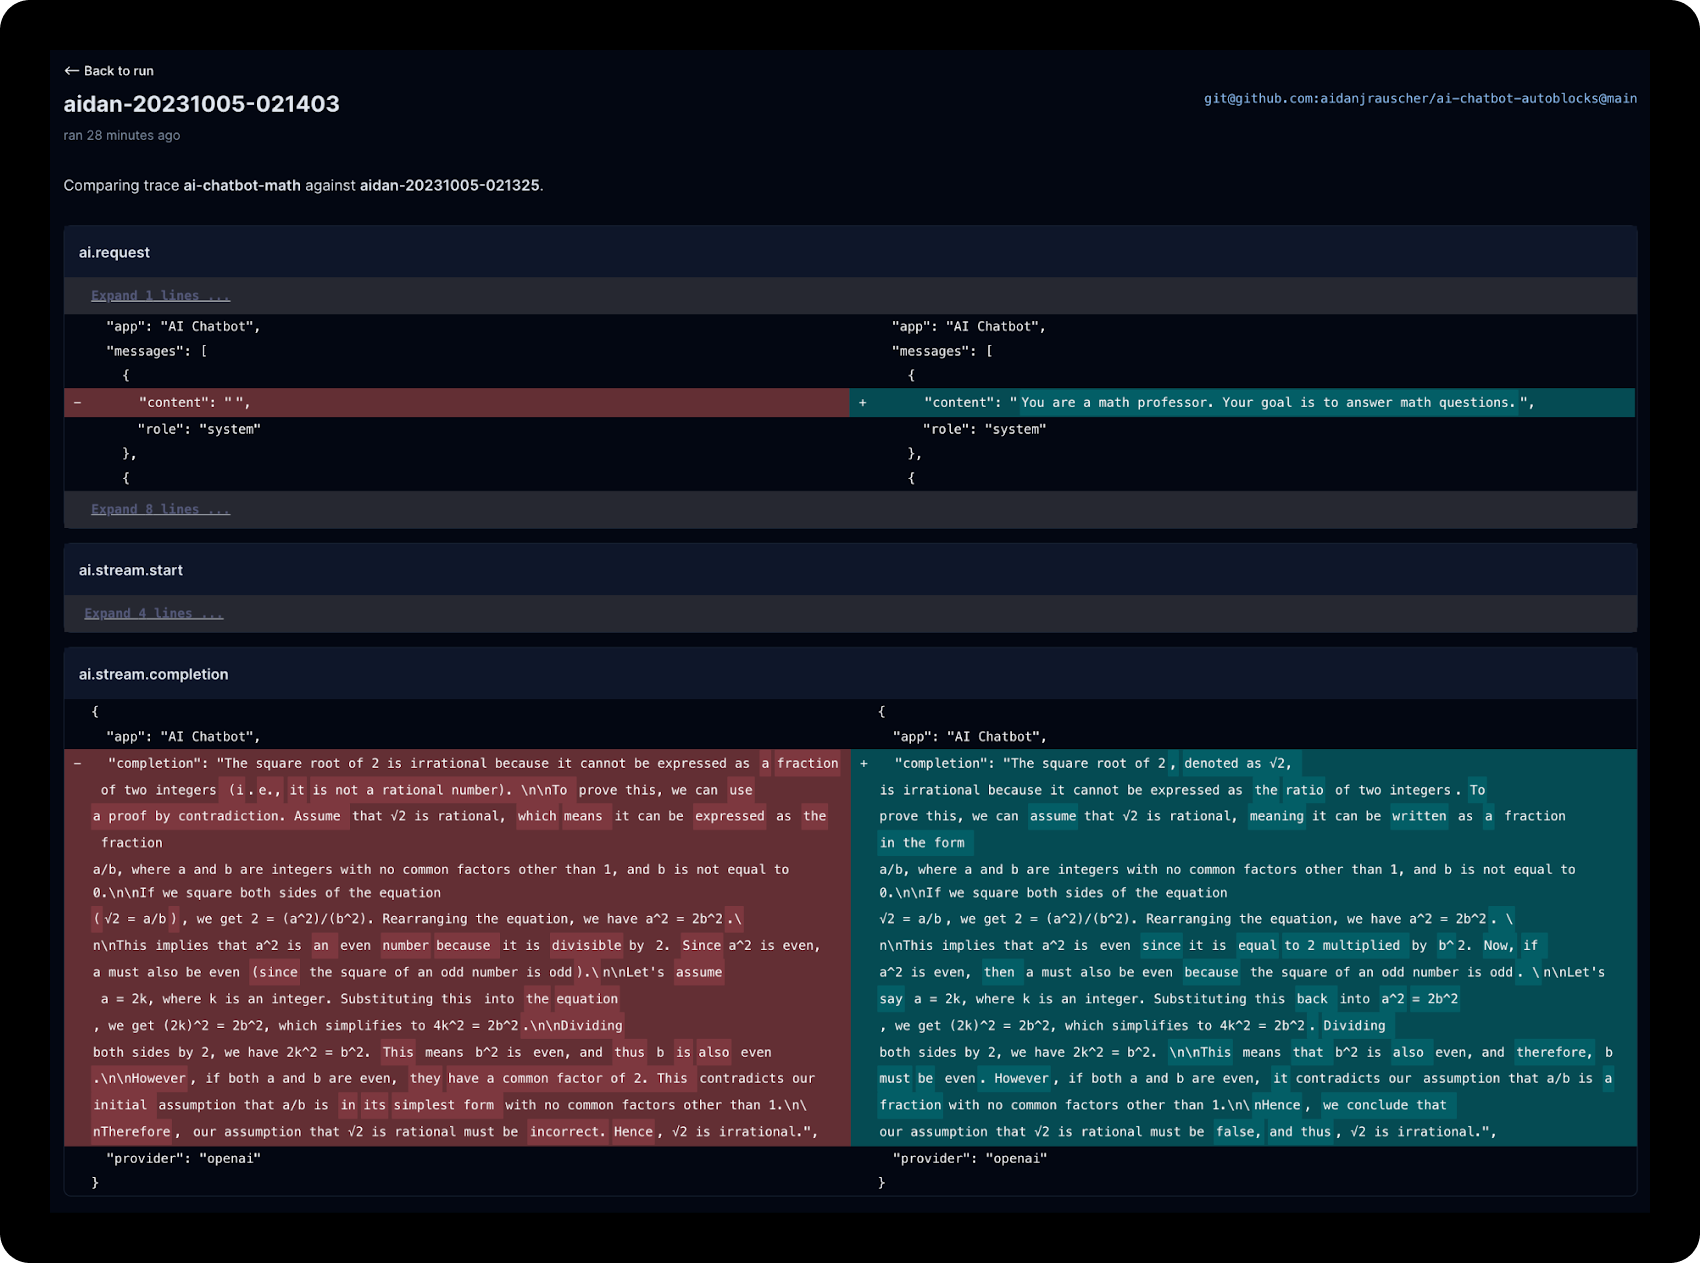
We see that the content for both the system prompt and the chat completion changed. However, both prompts produced similar outputs.
Let’s try that again. This time, with the most descriptive prompt we can think of.
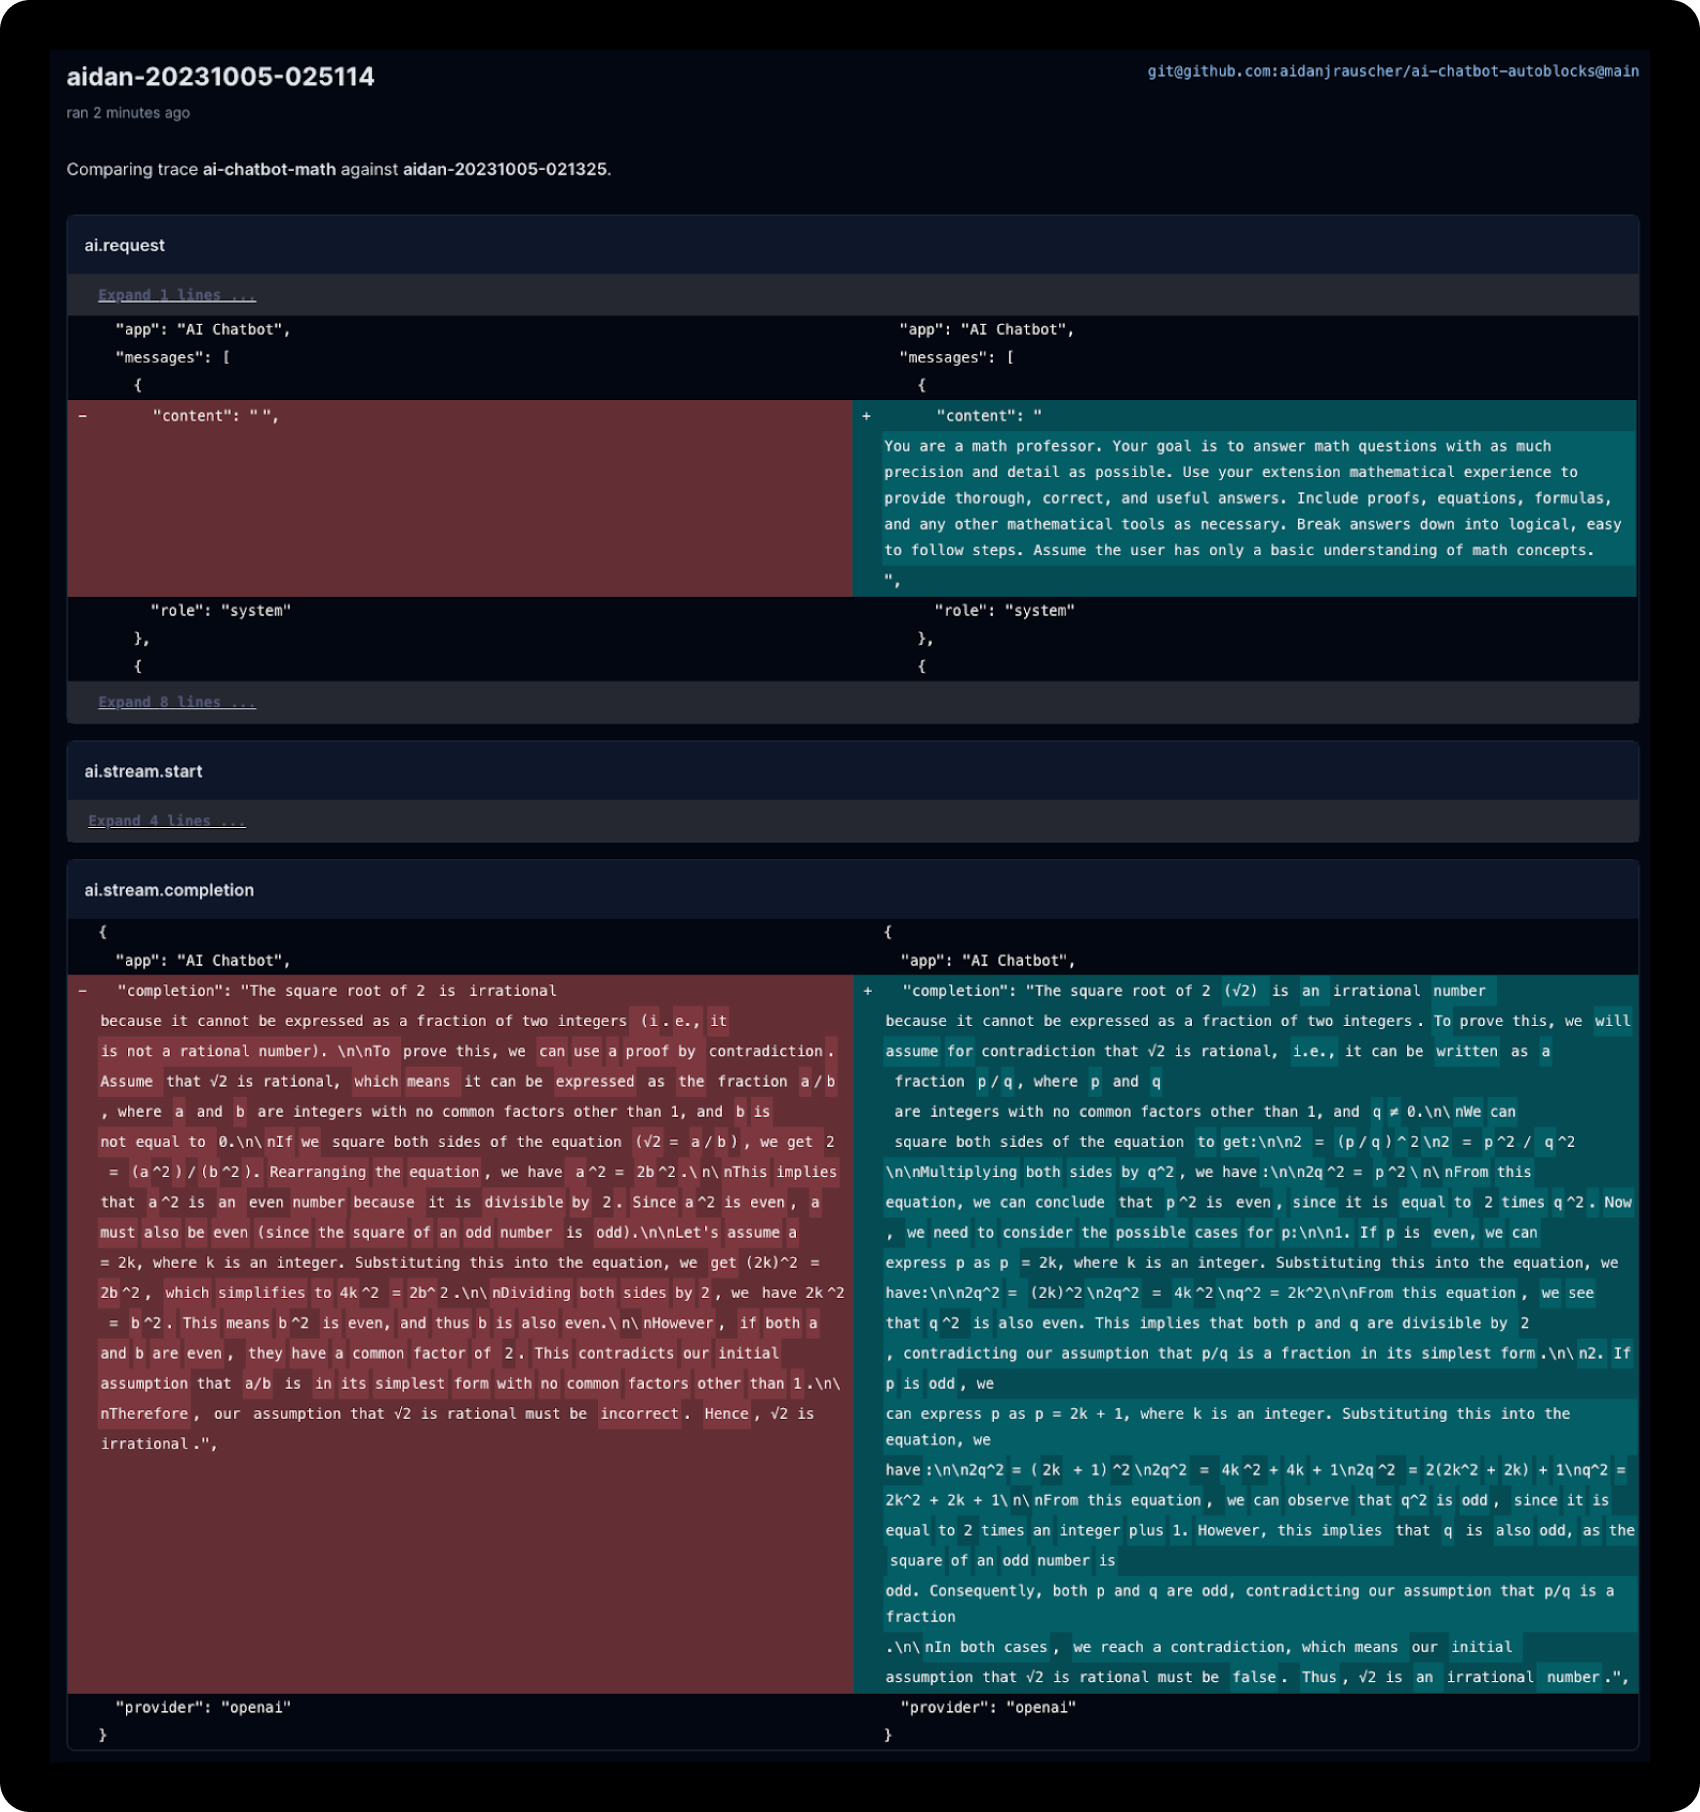
Great! The more descriptive prompt produced a much more thorough proof. That’s the kind of tutoring I was looking for!
Thanks to Replays, we were able to settle on an optimal prompt. Now, let’s explore how we can use Autoblocks’ data analytics and visualization features to keep a close pulse on our app’s performance in production.
How to Monitor Your App in Production
As we get more usage on our math chatbot app, we’ll want to empower our team with the data they need to 1/ debug errors and 2/ identify usage trends — both of which will influence changes we make to the app (which you would test through Replays 😃).
The Autoblocks analytics features let us quickly search and filter traces & visualize key metrics.
We can start in Explore, where all our trace data is displayed. We can search, filter, and group them by any custom property we’ve included with our events.
Here’s an example where we filter completions by their latency in milliseconds, which can help track the performance of our chat app.
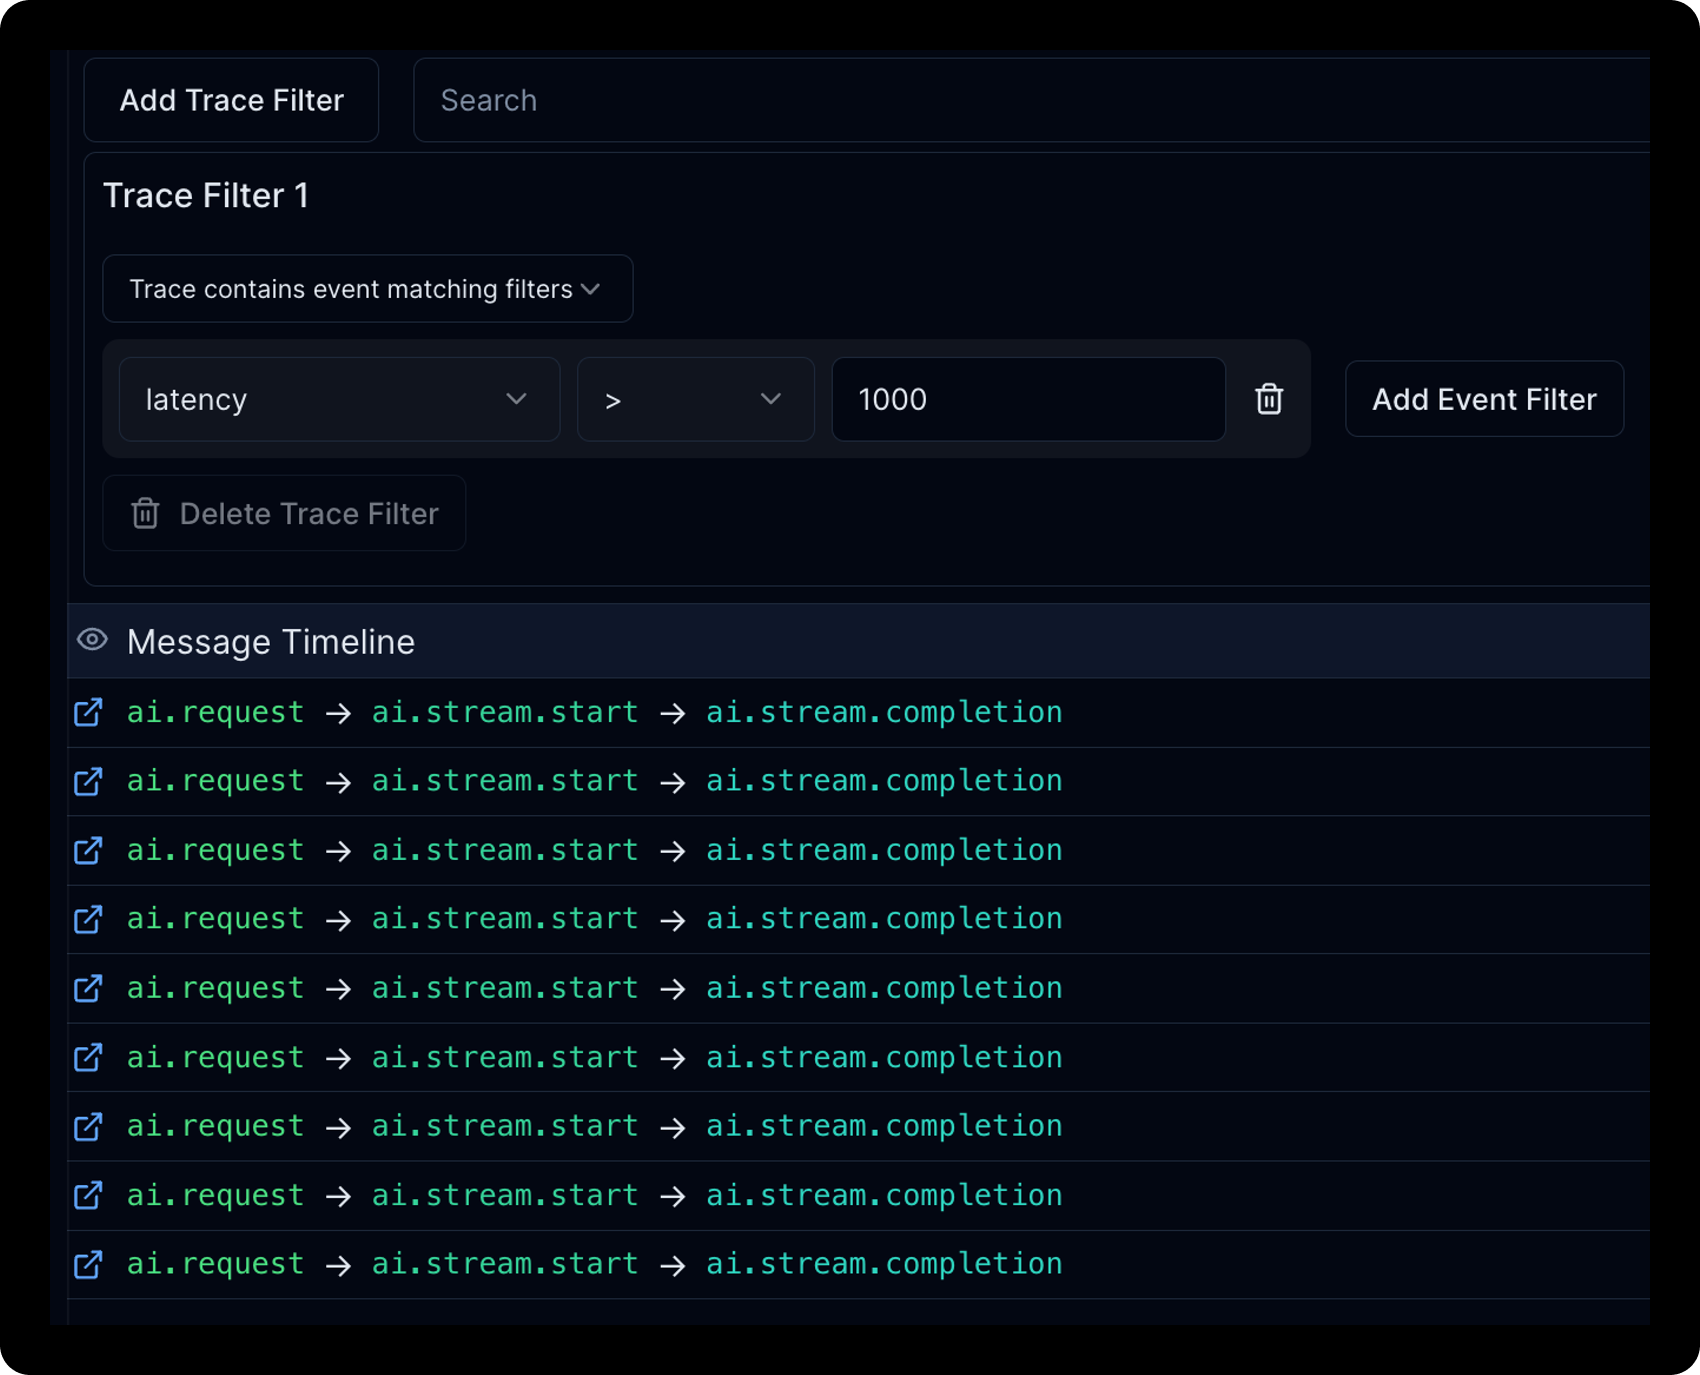
The Explore tab also lets us chart data. We can create a chart showing the average latency of traces.
If we create a really useful chart, we can save it as a View. For quick access, saved views will show up in the navigation sidebar.
Autoblocks Dashboards allow us to consolidate our favorite Views, so we’re only one click away from seeing our app’s most important data, like average latency or user feedback.
To create a dashboard, we simply open the Dashboard tab and click Add View.
We can continue adding as many views as we want to the dashboard and create multiple dashboards. For example, you might create a distinct one for your design team.

Closing Thoughts
Autoblocks makes developing AI-powered applications — like the math tutor chatbot — a seamless (and honestly, quite fun) process.
With tools like Traces and Replays, developers can better understand and adapt their code to specific use cases.
On top of that, the platform’s analytic tools — Explore, Views, and Dashboards — empower product teams to debug problems, diagnose performance issues, and have full visibility into usage trends.
If you would like to look through the code from this blog, it’s available on GitHub: https://github.com/aidanjrauscher/ai-chatbot-autoblocks.

